When you build a new scale, the first thing that wavers isn't the instrument — it's your confidence in yourself. Did the analysis I just ran actually run correctly? Can I put this number straight into my paper? Any researcher who has spent days agonizing over a single fit index from an analysis tool knows this feeling.
So we decided to doubt our own tool ourselves. The most honest way to check whether modidoc's analysis engine is truly trustworthy is to feed it a famous scale that tens of thousands of papers have already validated and see whether it returns the same results — a test whose outcome we cannot dictate.
We chose the Rosenberg Self-Esteem Scale (RSES). Published in 1965, this 10-item scale has served as the standard for self-report measurement of self-esteem. For data, we used 1,000 publicly available responses collected online — not data we generated, but real responses anyone can download.
The first gate of reproduction: did reliability come out the same?
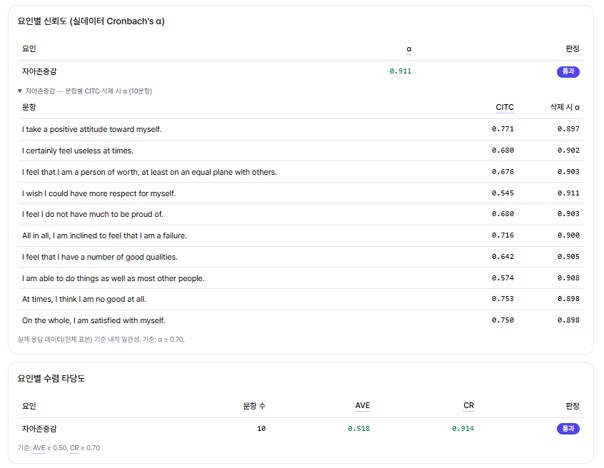
We started with internal-consistency reliability. Cronbach's alpha measures whether items consistently tap a single concept, and the common threshold is α ≥ 0.7 (Nunnally, 1978).
For the RSES, the alpha reported in the literature generally falls between 0.77 and 0.88 across samples, and as wide as 0.84 to 0.95. The alpha modidoc computed on this public data was 0.911 — squarely within the known range.
This is the first gate of reproduction testing: feeding the same scale and real response data, the tool returns the same reliability reported in the literature. That is direct evidence the analysis engine is performing standard statistical procedures by the book.
The dimensionality debate reproduced exactly
The interesting part came next. By original design, the RSES is a unidimensional scale measuring a single concept — self-esteem. So we grouped the 10 items into one factor and ran a confirmatory factor analysis (CFA), which evaluates how well a model fits the data using fit indices.
The results came out like this.
| Fit index | Threshold | Reproduced result | Source |
|---|---|---|---|
| CFI | ≥ 0.90 | 0.869 | Hu & Bentler (1999) |
| RMSEA | ≤ 0.08 | 0.146 | Browne & Cudeck (1993) |
| SRMR | ≤ 0.08 | 0.065 | Hu & Bentler (1999) |
CFI fell short of the threshold and RMSEA exceeded it substantially. In other words, a single-factor model does not fit well.
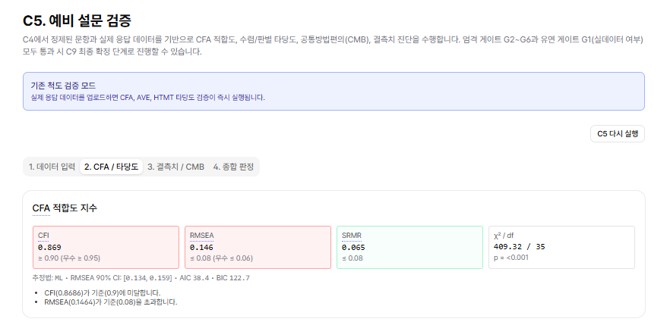
At first glance this reads as if the scale has a problem. But any researcher who knows the RSES will find this result familiar. The dimensionality of the RSES has been a methodological debate for 60 years. The five positively worded items ("I am a person of worth") and the five negatively worded items ("At times I think I am no good at all") move slightly differently in statistical terms. In many validation studies the scale splits into a two-factor structure separating positive and negative items, interpreted as a method factor arising from item wording.
In short, modidoc reporting a misfit under the single-factor model is not because it analyzed the scale incorrectly. The tool precisely captured the dimensionality debate the RSES has carried all along. The reproduction we wanted was not "a good result" but "the same result as the literature" — and reproducing this debate is exactly that evidence.
Item 8: the same signal caught in the same place
Going down to the item level makes the reproduction even sharper. The corrected item-total correlation (CITC) measures how much one item moves in the same direction as the rest, with a common threshold of CITC ≥ 0.3.
Among the 10 items, the lowest value belonged to Item 8, "I wish I could have more respect for myself." Its CITC was 0.545, and removing it kept the overall alpha at 0.911 or nudged it slightly upward — a sign that it is the most loosely fitting item in the scale.
This item has been flagged repeatedly across validation studies at home and abroad. Studies analyzing Korean adolescent and university-student samples have also found this item behaving out of step with the others. In the public data we ran, the same item was singled out in the same way — meaning the tool pinpointed a known problem item in its known place.
Convergent validity passed; discriminant validity was not computed
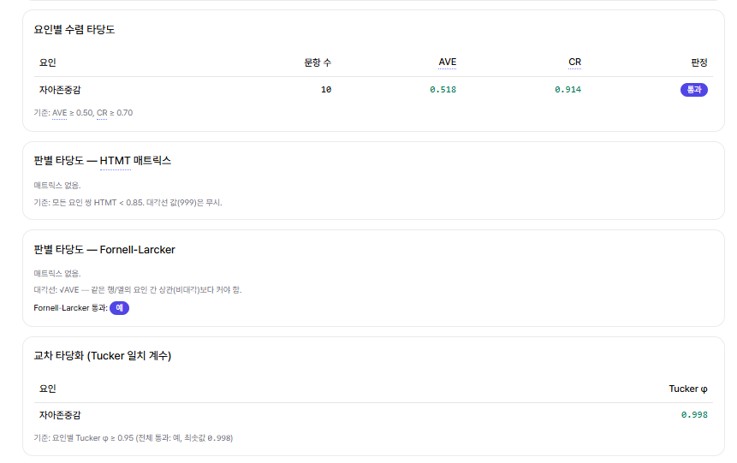
After the factor structure, we looked at convergent validity — whether the items grouped under a factor share that factor sufficiently, assessed jointly through average variance extracted (AVE) and composite reliability (CR). The thresholds are AVE ≥ 0.5 (Fornell & Larcker, 1981) and CR ≥ 0.7.
The reproduced AVE was 0.518 and CR was 0.914, clearing both thresholds. The AVE sits just above 0.5, and this stems from the same root as the dimensionality debate above: the method factor created by the negative items lowers the variance the items share somewhat.
Discriminant validity is a different story. It measures whether two distinct factors are conceptually separable, using HTMT (< 0.85, Henseler et al., 2015) and the Fornell-Larcker criterion. But in this analysis neither the HTMT matrix nor the Fornell-Larcker matrix was produced — because there is only a single factor, self-esteem, and no other factor to compare against. Discriminant validity is only meaningful when two or more factors exist, so its absence for a single-factor scale is not a defect but a structural inevitability. modidoc, too, treated this case not as a violation but as "no comparison target."
It doesn't stop at validation — where it spares the researcher's effort
Up to here the story was that "reproduction works" — the basis for trusting modidoc as a tool. But during the reproduction, modidoc did two more things beyond the standard procedure.
The first is reverse-item handling. The data we fed in was in its original wording direction, with reverse-scored items not pre-recoded. Normally a researcher has to hunt down each negative item and recode it before running the analysis. modidoc identified the reverse items on its own, recoded them automatically, and then ran the analysis — yielding values identical to pre-recoded data. The tool heads off the common accident where a coding mistake throws off the entire reliability estimate.
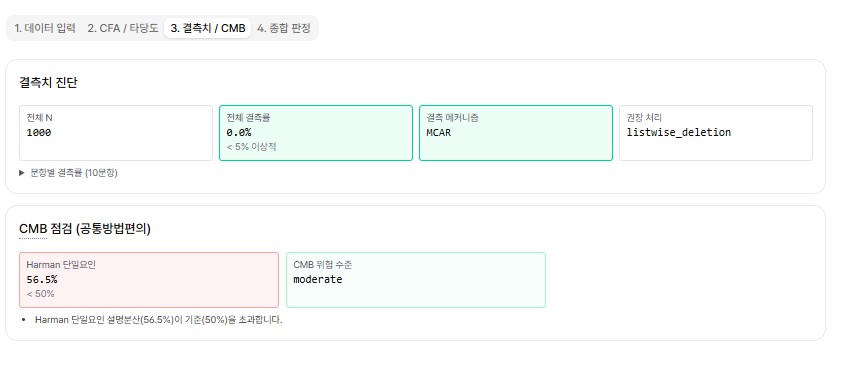
The second is the common method bias (CMB) check. A single self-report survey can have its inter-item correlations inflated by respondents' answering tendencies. A simple way to gauge this risk is Harman's single-factor test: if one factor explains more than 50% of the total variance, caution is warranted (Harman, 1976). In this data the single factor explained 56.5% of the variance, exceeding the threshold, and modidoc flagged this signal along with a risk level. It means the tool doesn't stop at handing over a validation result — it also tells you what else you need to examine.
How modidoc supports this process
modidoc's advanced validation stage runs confirmatory factor analysis, convergent and discriminant validity, reliability, and the common method bias check all at once when you upload real response data. Even if you upload raw data with reverse-scored items mixed in, the system identifies and recodes the reverse items automatically before analyzing, reducing errors introduced at the coding step. Each metric records the rationale behind its pass/fail judgment, so you can re-explain why a result came out the way it did. This process is implemented internally as the C5 advanced validation engine.
If, like this reproduction test, you want to re-run an already-published scale and check the results, you can try it yourself at modidoc.
Frequently asked questions
Is there any point in re-validating a published scale?
Yes. Even for a published scale, whether the same structure reproduces in your sample, your culture, and your response conditions has to be checked separately. Especially when you use an adapted (translated) scale, there is no guarantee the original factor structure holds, so re-confirming reliability and factor structure before the main analysis is recommended.
If single-factor CFA fit is poor, does that mean the scale is flawed?
Not necessarily. Scales that mix positive and negative items, like the RSES, often show poor fit under a single-factor model. This is interpreted as a method factor arising from item wording — more a matter of model specification and scale structure than a defect of the scale itself. In such cases, a two-factor model or a model that incorporates a method factor should be examined as well.
Do reverse-scored items have to be recoded before analysis?
Yes. If reverse items are not recoded, reliability and factor-analysis results are distorted. Negatively worded items run in the opposite score direction, so they must be aligned before analysis. modidoc handles this recoding automatically, but if you analyze on your own, mark the reverse items clearly in your codebook and always confirm whether they have been recoded.
Coming up next
In the next post, we cover how to compare and judge a two-factor model and a method-factor model when a single-factor model shows poor fit. Behind the one-line result of "fit below threshold," what do you actually need to decide? We lay out the criteria. (In preparation)